Desk research · Proprietary capital

A daily record of our trading desk

Ekalon trades systematic books in US and Indian futures and index options with its own money. Every trading day we publish a note on MES, MGC, CL, NIFTY, SENSEX and GIFT Nifty, how each of our books did, how closely live trading followed its model, and how much risk it carried.

Live and research kept apartReturns as % of capitalNo rules, strikes or positions
Latest note

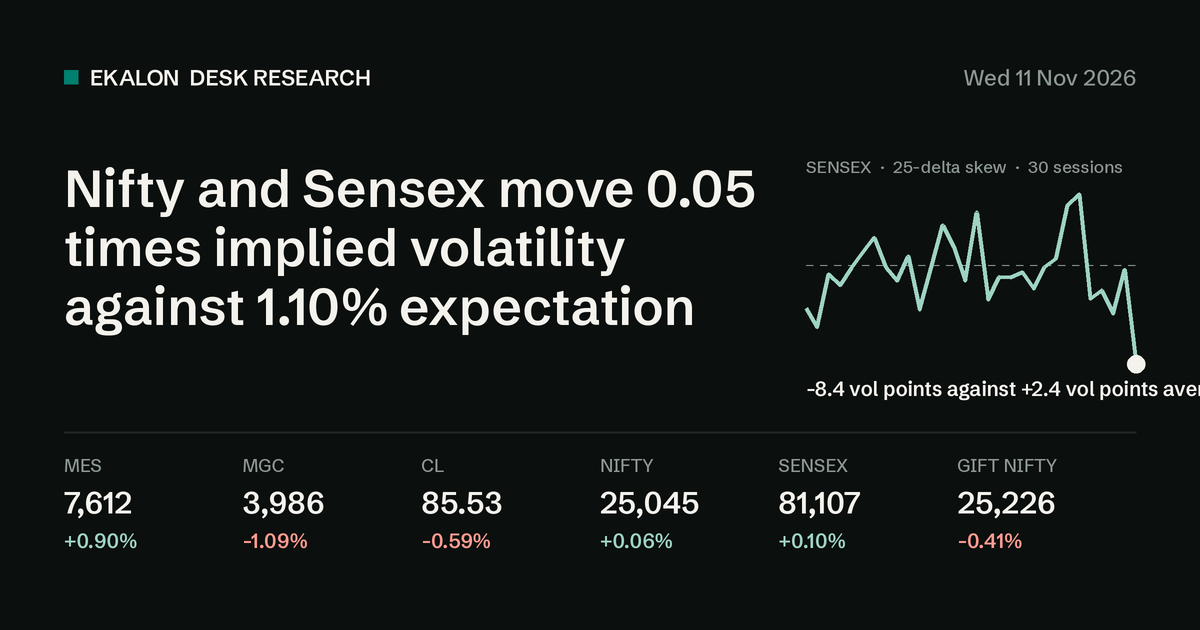
Wednesday 11 November 2026

Desk note

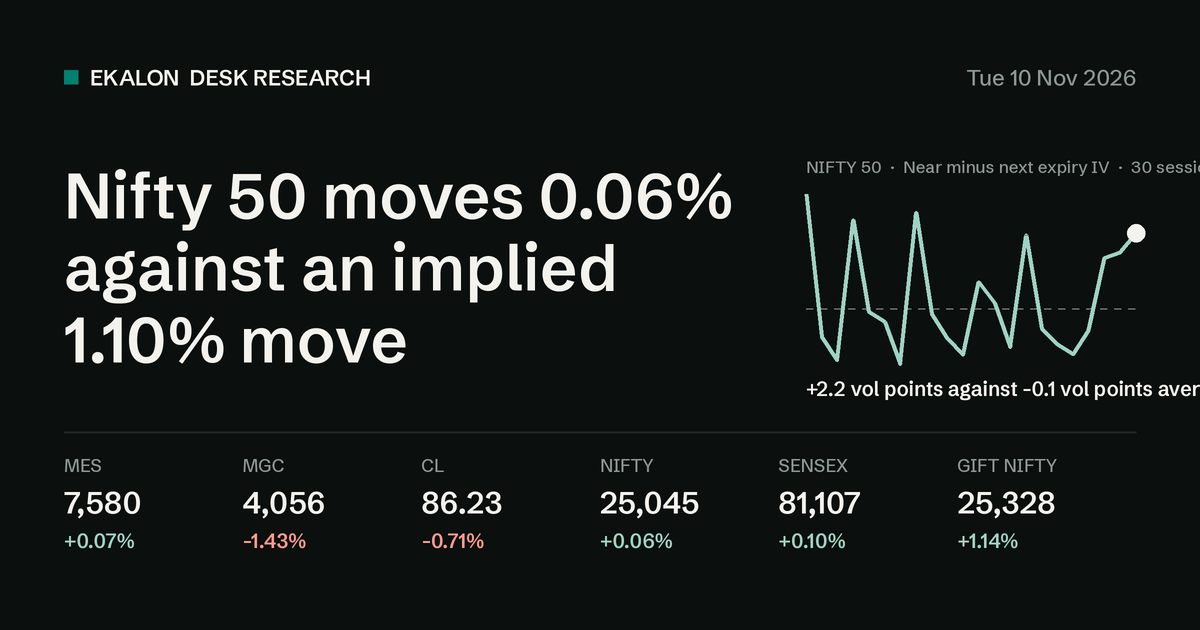
Nifty and Sensex move 0.05 times implied volatility against 1.10% expectation

SENSEX 25-delta put minus call implied volatility reached -8.4 vol points, 3.0 standard deviations below the 20-session average.

Nifty and Sensex move 0.05 times implied volatility against 1.10% expectationRead the note

Get the desk note by email

One email each trading day before the Indian open. Percentages only, no tips, unsubscribe in one click.

Track record · updated 11 Nov 2026

Books

Live curves start on each book's first live session. Research history sits beside them and is never joined on.

US Index Options

Systematic, S&P 500 index options

Live since 7 Jul 2026Research from 15 Feb 202319 sleeves
Last session
-0.73%
Month to date
+0.59%
Since live start
+1.06%
85 sessions
Live max drawdown
-9.13%
LiveEquity, indexed to 100
100.0105.0AugSeptOctNov101.1
ResearchEquity, full history
100.0200.0300.0202420252026354.9
Statistics
StatisticLiveResearch
Sessions85936
Total return+1.06%+253.61%
Annualised return+3.1%+68.3%
Annualised volatility13.2%26.3%
Sharpe0.242.59
Sortino0.254.00
Max drawdown-9.1%-6.4%
Current drawdown-6.8%-2.6%
Longest drawdown, sessions3767
Up sessions64%62%
Best session+2.29%+4.63%
Worst session-3.41%-4.73%
Skew-1.29-0.51
ResearchDrawdown from previous high
-6.0%-4.0%-2.0%0.0%202420252026-2.2%
ResearchMonthly returns, % of capital
JanFebMarAprMayJunJulAugSepOctNovDecYear
202610.014.18.711.2-3.86.0-19.413.6-0.5-6.07.041.0
20254.411.014.010.28.3-4.11.813.111.91.5-5.721.788.2
20242.55.36.85.05.11.48.60.57.213.76.30.262.6
20237.78.62.613.7-1.08.5-0.75.00.310.46.661.8
Execution

Live trading against the model

US Index Options

Live against the model on the same 91 sessions and the same capital.

Daily correlation
0.97
Live minus model
+1.08%
cumulative
Slippage
9.2 bps
of traded premium
Fees
4.6 bps
of traded premium
98.0100.0102.0AugSeptOctNov102.8
Live 102.8Model 101.7
0100200AugSeptOctNov9

India Index Derivatives

Live against the model on the same 19 sessions and the same capital.

Daily correlation
0.91
Live minus model
+0.28%
cumulative
Slippage
17.7 bps
of traded premium
Fees
58.1 bps
of traded premium, estimated
100.0101.0Nov101.4
Live 101.4Model 101.1
-25025Nov35
Correlation

Books against each other and the market

Daily return correlation over the full research history, 880 common sessions.

US optionsIndia optionsNIFTY 50S&P 500
US options1-0.010.07-0.07
India options-0.011-0.07-0.01
NIFTY 500.07-0.0710.13
S&P 500-0.07-0.010.131
Disclosure

Ekalon Solutions trades this desk with its own proprietary capital. It does not manage outside money, give investment advice or sell signals, and it is not registered with SEBI as a research analyst or investment adviser. Returns are percentages of the capital allocated to each book. India live results are after estimated exchange charges, taxes and brokerage. Research results are simulated: they are hypothetical, are built with hindsight and are always shown apart from live results. Past performance does not indicate future results. Nothing on this page is an offer or a recommendation to trade any instrument.

What clients stopped paying for